“Are You the One” is a reality style dating show. The show consists of two groups of 10 heterosexual men and women living together in a house at an exotic location. The goal is not for them to find their ideal partner among the other players, but to instead find who was predetermined to be their perfect match. If all players can find all their match within ten weeks, the group wins one million dollars.
The players get two types of information every week. First, they get to send one potential couple into a “truth booth” to learn whether or not they are a match. They can send the same person in as many times as the like, but once a couple is identified as a perfect match, they are removed from the competition. The contestants also get a “light ceremony” each week. For this, they form into a potential set of pairings between the men and women, with each man or woman only allowed to pair up with one other man or woman. They are then told the total number of these pairings that are correct, but not which. The contestants have ten weeks, each week containing a truth booth phase and light ceremony phase.
This makes the game an interesting variant of the more well-studied game, Master Mind. An analysis of this game, from none other than Donald Knuth, was the original inspiration for looking at this modern reality-dating-tv incarnation. The purpose of this note will be to connect the approach given by Knuth to information theory and prove that you cannot guarantee a win in \(N\) timesteps for \(N\) men and \(N\) women.
We can think of this setup as a bipartite graph with one set representing the men and the other representing the women. Each node will contain exactly one edge, representing a match. For \(N\) members of each gender, there are \(N!\) unique valid graphs. Since only one of these permutations is correct, the odds of successfully guessing via random chance are \(\frac{1}{N!}\). This means if the players were playing totally randomly for \(n\) members of each gender and \(m\) weeks:
\[ p(\text{win}; n, m) = 1 - p(\text{lose}; n, m) = 1 - (1 - \frac{1}{n!}) ^ m \]
This means the baseline \(p(\text{win}; 10, 10) \approx 2.75e-06\). They key to the game, of course, is using the information from the truth booth and light ceremony to remove as many possible graph combinations as possible. We will call the set of valid graphs at every step in the process \(G_t\), with \(G_0 = N!\)
I will try to describe some of the basics of information theory, but I highly recommend reading through Claude Shannon’s original A Mathematical Theory of Communication. For a foundational work, it is very approachable.
“You should call it entropy, for two reasons. In the first place your uncertainty function has been used in statistical mechanics under that name, so it already has a name. In the second place, and more important, nobody knows what entropy really is, so in a debate you will always have the advantage.” - Von Neumann to Claude Shannon on the naming of Entropy 1
Entropy is a measure of the amount of uncertainty in a probability distribution. It is typically defined, for a random variable \(X\), as
\[ H(X) = - \sum^N_{i=1} P(x_i) \log P(x_i) \] 2
Or as an expectation:
\[ H(X) = E_{x_i \in X}[ - \log P(x_i)] \]
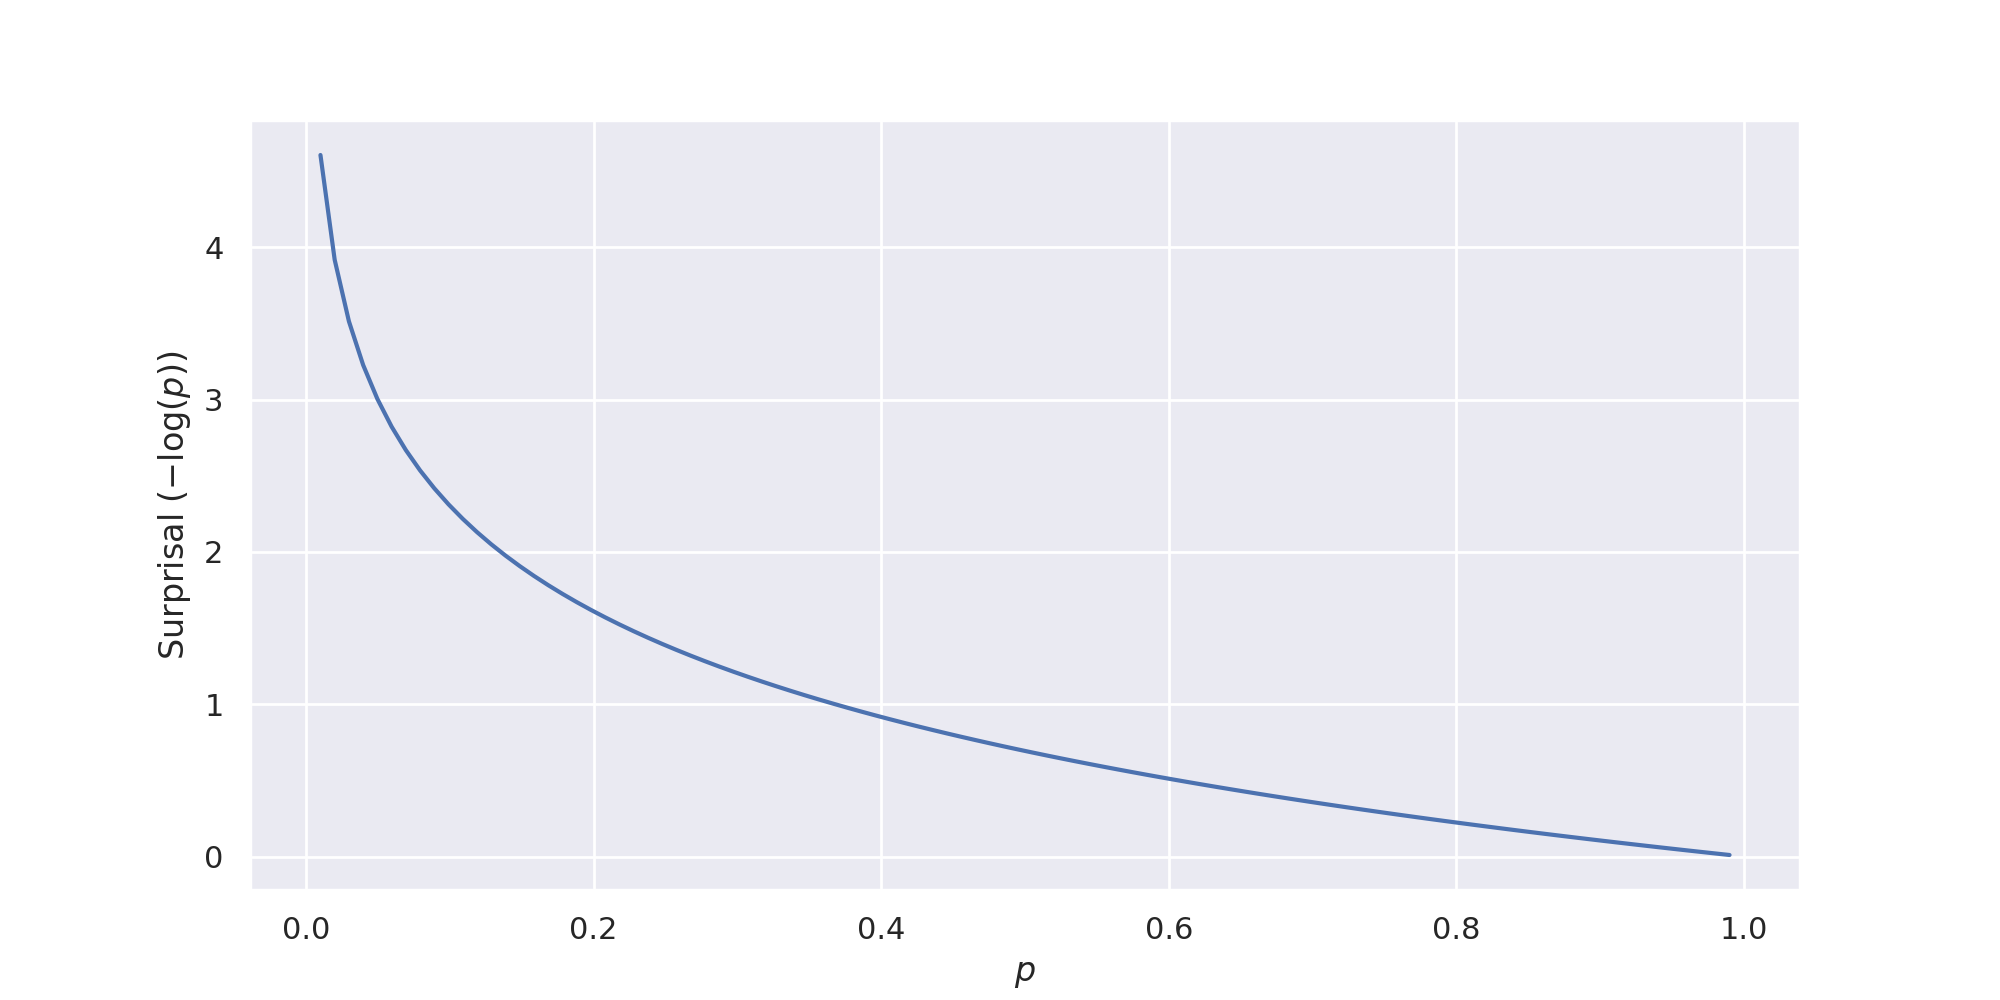
Why \(- \log P(x_i)\)? This is our metric of surprisal. This was chosen in part because it “is nearer to our intuitive feeling as to the proper measure.” When we observe an event with probability of 1, our surprisal is 0. When we observe an event with a probability approaching zero (but not exactly zero, since we then couldn’t observe it) our surprisal approaches \(\inf\). Entropy is then simply how much surprise we should expect from a random variable. The more expected surprise, the less information about we have.
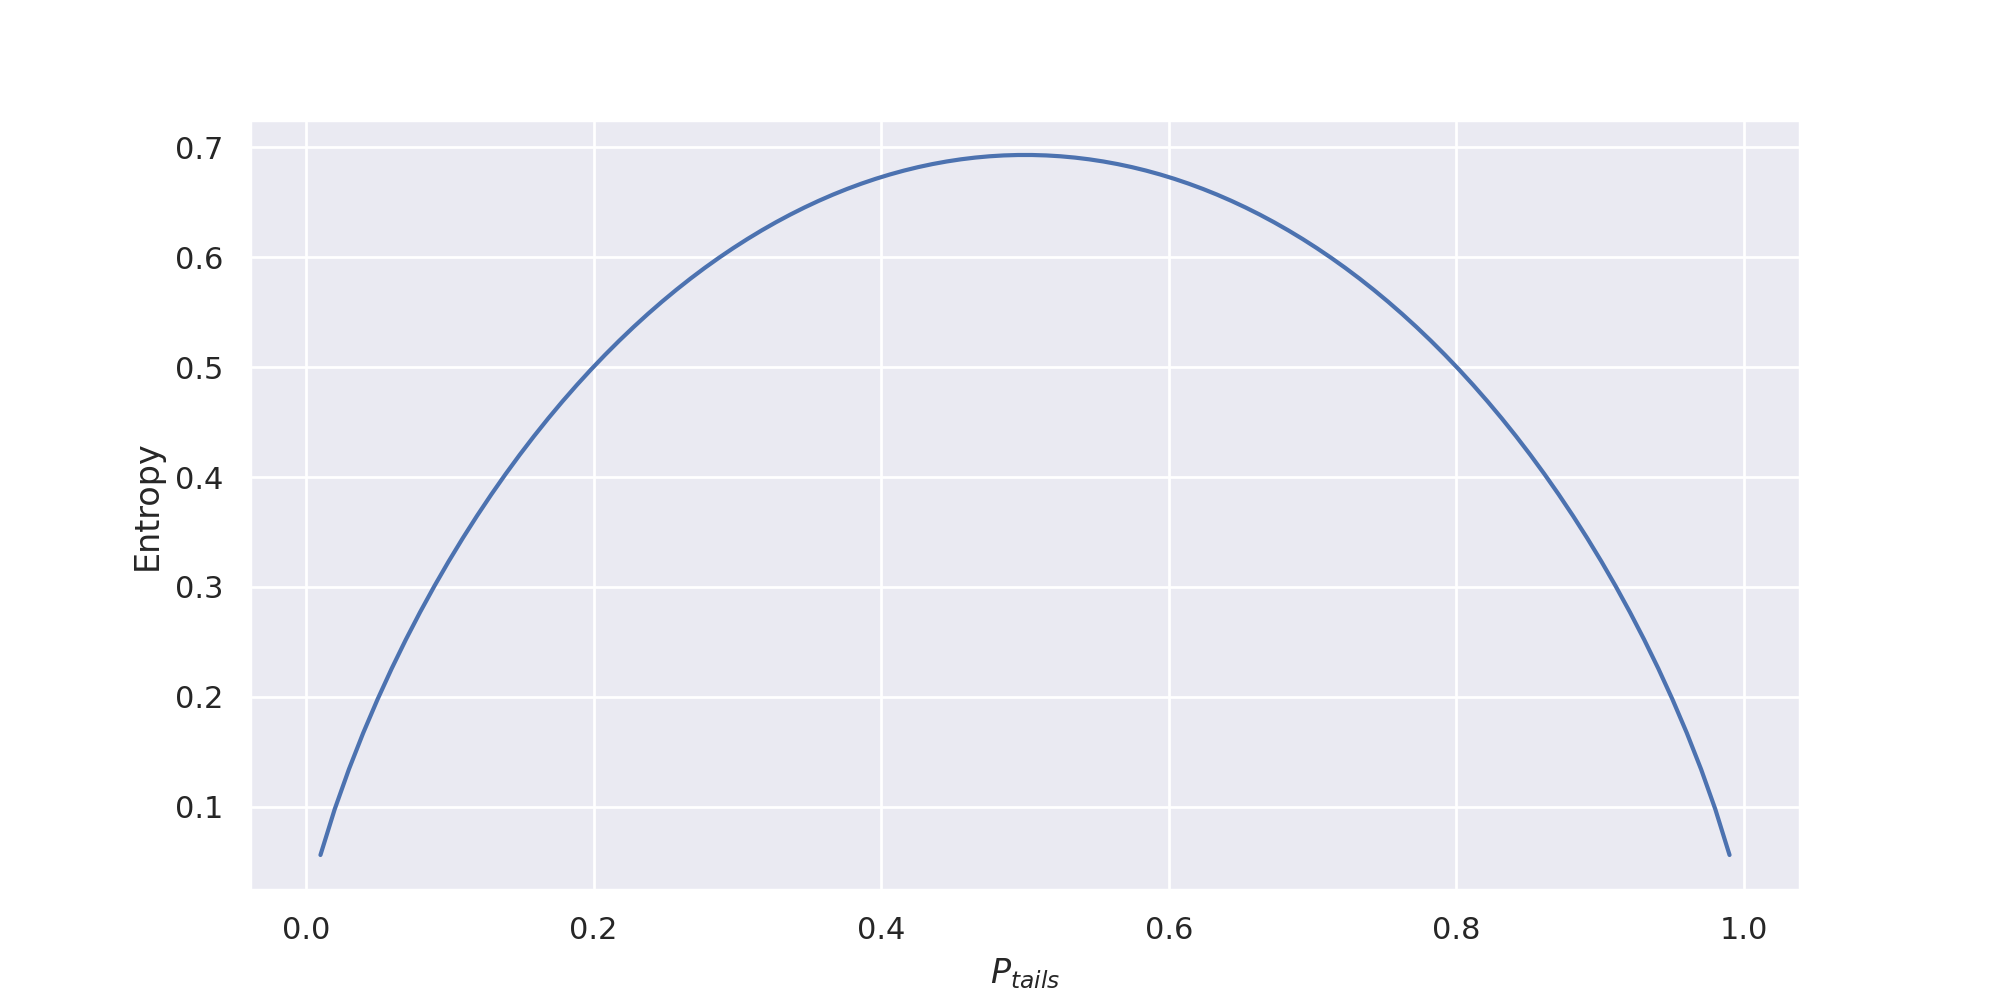
To build intuition, imagine a two-sided coin is flipped and then immediately covered. A person standing by the coin tells you it landed as tails. How surprised should you expect to be when the coin is uncovered?
Before this person speaks, you effectively have no information about the result of the flip. Having zero information corresponds to the maximum expected surprisal (\(P(x_{heads}) = P(x_{tails}) = 0.5\), \(H(X) \approx 0.69\)). After the person speaks, the question is then how much you trust them. If the person lies \(10\%\) of the time, the updated \(P_{tails} \approx 0.9\). Your expected surprisal has decreased since you heavily expect the coin to come up tails and you have gained some information about the outcome.
This is the rough connection we can think of between information and entropy. Any gain information will cause our entropy to decrease.
For Are You The One, our distribution is over all the possible valid graph configurations. There are \(N!\) different possible values for our perfect match, and each are equally likely. Since \(G_t\) is the set of possible valid graphs at time \(t\), then we can compute the entropy as follows:
\[ H(G_t) = - \sum_{g_i \in G_t} P(g_i) * \log P(g_i) \] \[ H(G_t) = - |G_t| * \frac{1}{|G_t|} * \log\frac{1}{|G_t|} \] \[ H(G_t) = - \log \frac{1}{|G_t|} \]
Every time we observe the outcome for a truth booth or light ceremony, we gain information by decreasing \(|G_t|\).
To build some intuition, lets first implement and evaluate some simple strategies. The first and easiest is totally random guessing. This represents not using any information at all. We can then try to incorporate the two sources of information in parts. First, “Random Light Ceremony + Valid Truth Booth”, will not incorporate any information from the light ceremony to constrain the possibilities, but will incorporate the information from the truth booth. “Valid Light Ceremony + Random Truth Booth” will do the opposite and “Valid Light Ceremony + Valid Truth Booth” will constrain based on the information from both.
| Sample Size | P(win) | Mean | Worst | |
|---|---|---|---|---|
| Human Baseline | 8 | 0.875 | - | - |
| Totally Random | 1040 | 0.0 | 3.69e6 | 2.2e7 |
| Random Light Ceremony + Valid Truth Booth | 1040 | 0.001 | 32.32 | 64 |
| Valid Light Ceremony + Random Truth Booth | 1040 | 0.854 | 9.09 | 13 |
| Valid Light Ceremony + Valid Truth Booth | 1040 | 0.908 | 8.74 | 13 |
Plotted below is the mean entropy at every decision step for each of these strategies.
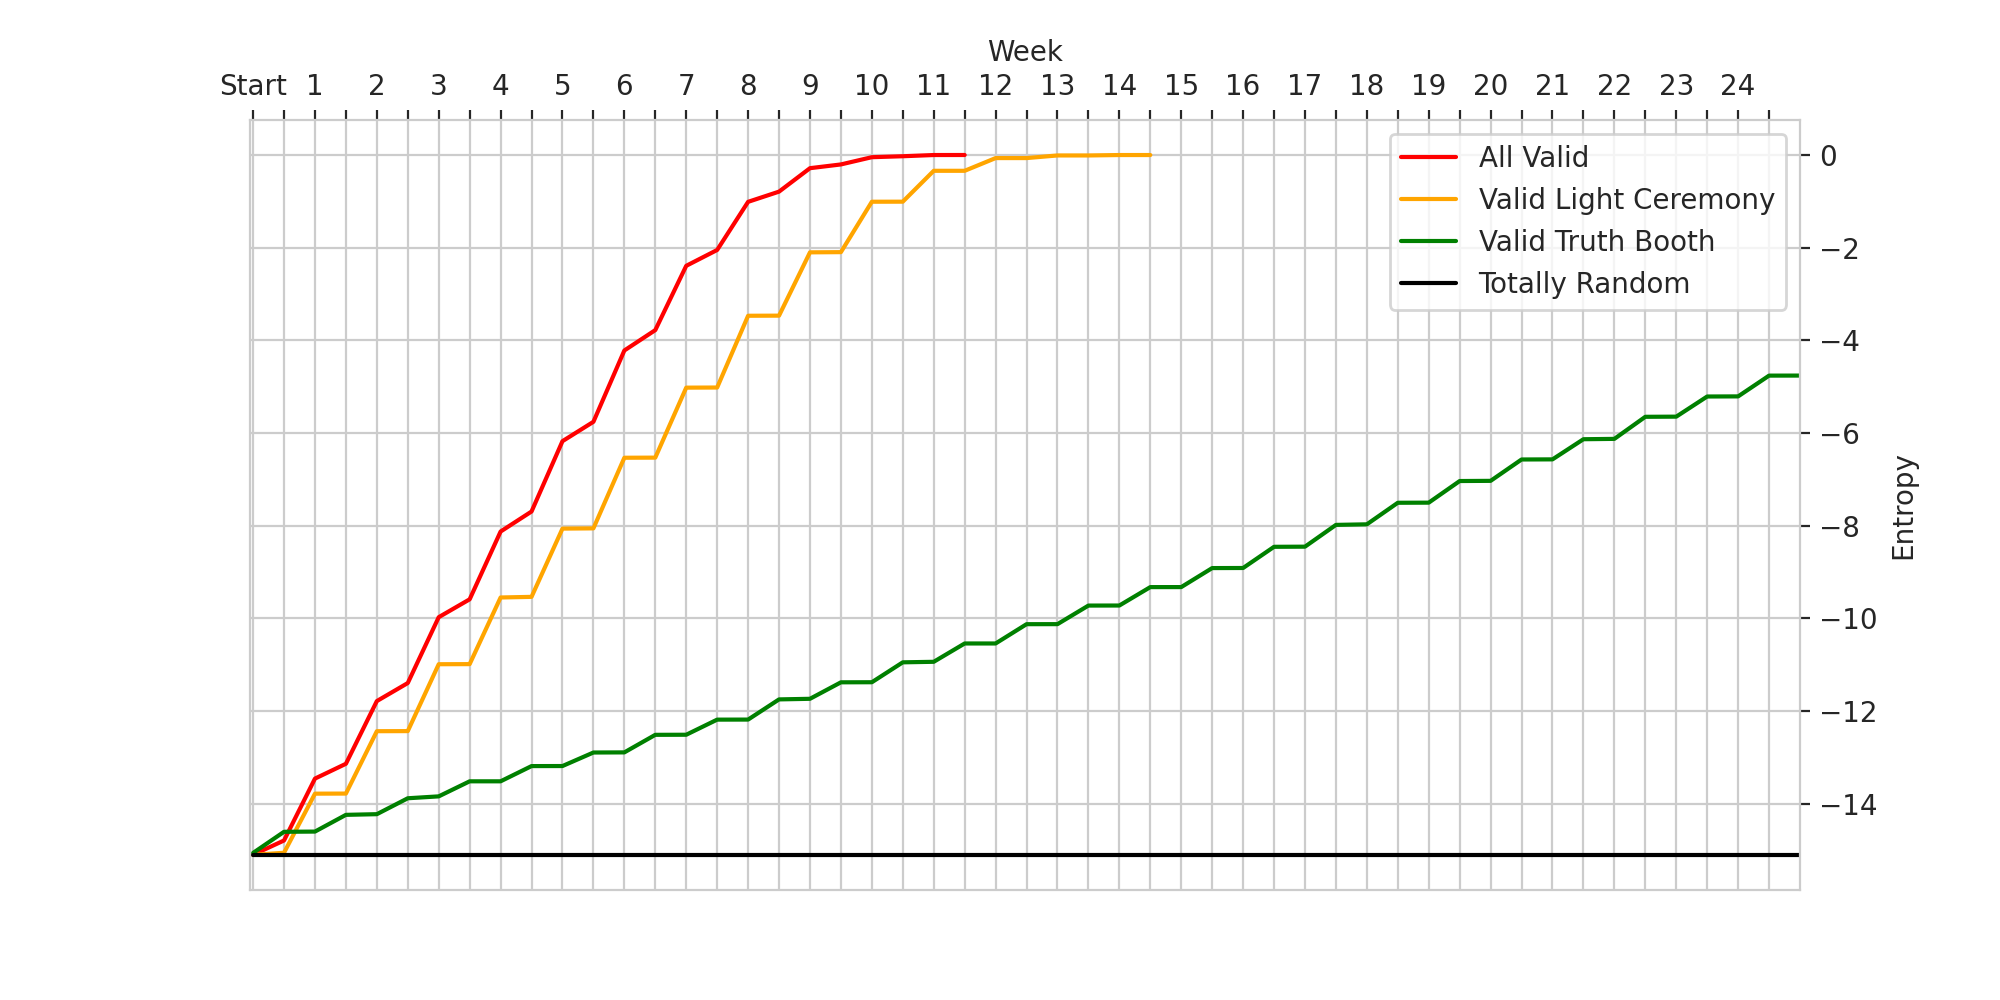
Each of the algorithms should be identifiable from just the shape of their lines. Since random never uses any of the information, it never decreases its uncertainty and therefore flatlines. The strategies that only incorporate information from only the truth booth or light ceremony move in a clear step-like pattern.
Why does incorporating the results for the light ceremony lead to much better performance? We can answer this question by looking at the amount of information you should expect to gain from each. Information gain can be calculated as the change of uncertainty:
\[ IG(d_t) = H(G_t) - H(G_{t + 1})\]
Where \(d_t\) is the decision made at time t. Plugging in our value for entropy from above:
\[ IG(d_t) = \log\frac{1}{|G_{t + 1}|} - \log\frac{1}{|G_t|} \]
We can think of this as the slope of the graph from the chart above. The goal is to get to 0, the steeper the slope the faster it reaches 0.
To compare the truth booth and light ceremony, lets look at the expected information gain from each in the first step. For a given truth booth, there are two possible outcomes: match or no match.
| Outcome | P(Outcome) | \(|G_{outcome}|\) | \(H(G_{outcome})\) | IG (nats) |
|---|---|---|---|---|
| Match | 0.1 | 362880 | -12.80 | 2.30 |
| Not Match | 0.9 | 3265920 | -15.00 | .1 |
The expected information gain in this case is:
\[ [\sum^2_{i=1} P(\text{outcome}_i) * H(G_{\text{outcome}_i})] - H(G_0) \]
Which for this first truth booth is \(\approx 0.32\) nats.
For the first light ceremony, there are more possible outcomes.
| Outcome | P(Outcome) | \(|G_{outcome}|\) | \(H(G_{outcome})\) | IG (nats) |
|---|---|---|---|---|
| 0 lights | 0.368 | 1334961 | -14.10 | 1.0 |
| 1 lights | 0.368 | 1334960 | -14.10 | 1.0 |
| 2 lights | 0.184 | 667485 | -13.41 | 1.69 |
| 3 lights | 0.061 | 222480 | -12.31 | 2.79 |
| 4 lights | 0.015 | 55650 | -10.93 | 4.17 |
| 5 lights | 0.003 | 11088 | -9.31 | 5.79 |
| 6 lights | 0.001 | 1890 | -7.54 | 7.54 |
| 7 lights | 6.6e-5 | 240 | -5.48 | 9.62 |
| 8 lights | 1.2e-5 | 45 | -3.80 | 11.3 |
| 9 lights | 0.0 | 0 | NaN | NaN |
| 10 lights | 2.8e-7 | 1 | 0.0 | 15.1 |
The expected information gain from the light ceremony is \(\approx 1.30\) nats, or about 4 times higher than the truth booth.
We can use this to find the optimal solution. We want to make the choice at each timestep that maximizes our expected information gain. We can also think about this as trying to find the highest expected surprisal. As we learned from the coin flip example, our surprisal is going to be maximized with \(P(\text{match}) = P(\text{not match}) = 0.5\) We therefore want to select the match with the probability closest to 0.5.
The light ceremony case is a little more difficult. To find the optimal case we can do a bruteforce search over all of the possible guesses and select the one that maximizes the expected information gain. As an algorithm, this ends up being \(O(|G_t|^2)\), which is infeasible when \(|G_t|\) is large. To save on compute time, we just select a threshold for \(|G_t|\) (in this case 100,000) and only perform the optimization step when \(|G_t|\) is smaller than the threshold. This is still very computational expensive, so we will only show results for both the optimized truth booth and optimized light ceremony at a smaller sample size.
| Sample Size | P(win) | Mean | Worst | |
|---|---|---|---|---|
| Valid Light Ceremony + Valid Truth Booth | 1040 | 0.908 | 8.74 | 13 |
| Valid Light Ceremony + Optimized Truth Booth | 1040 | 0.99 | 8.20 | 11 |
| Optimized Light Ceremony + Optimized Truth Booth | 500 | 0.99 | 8.11 | 11 |
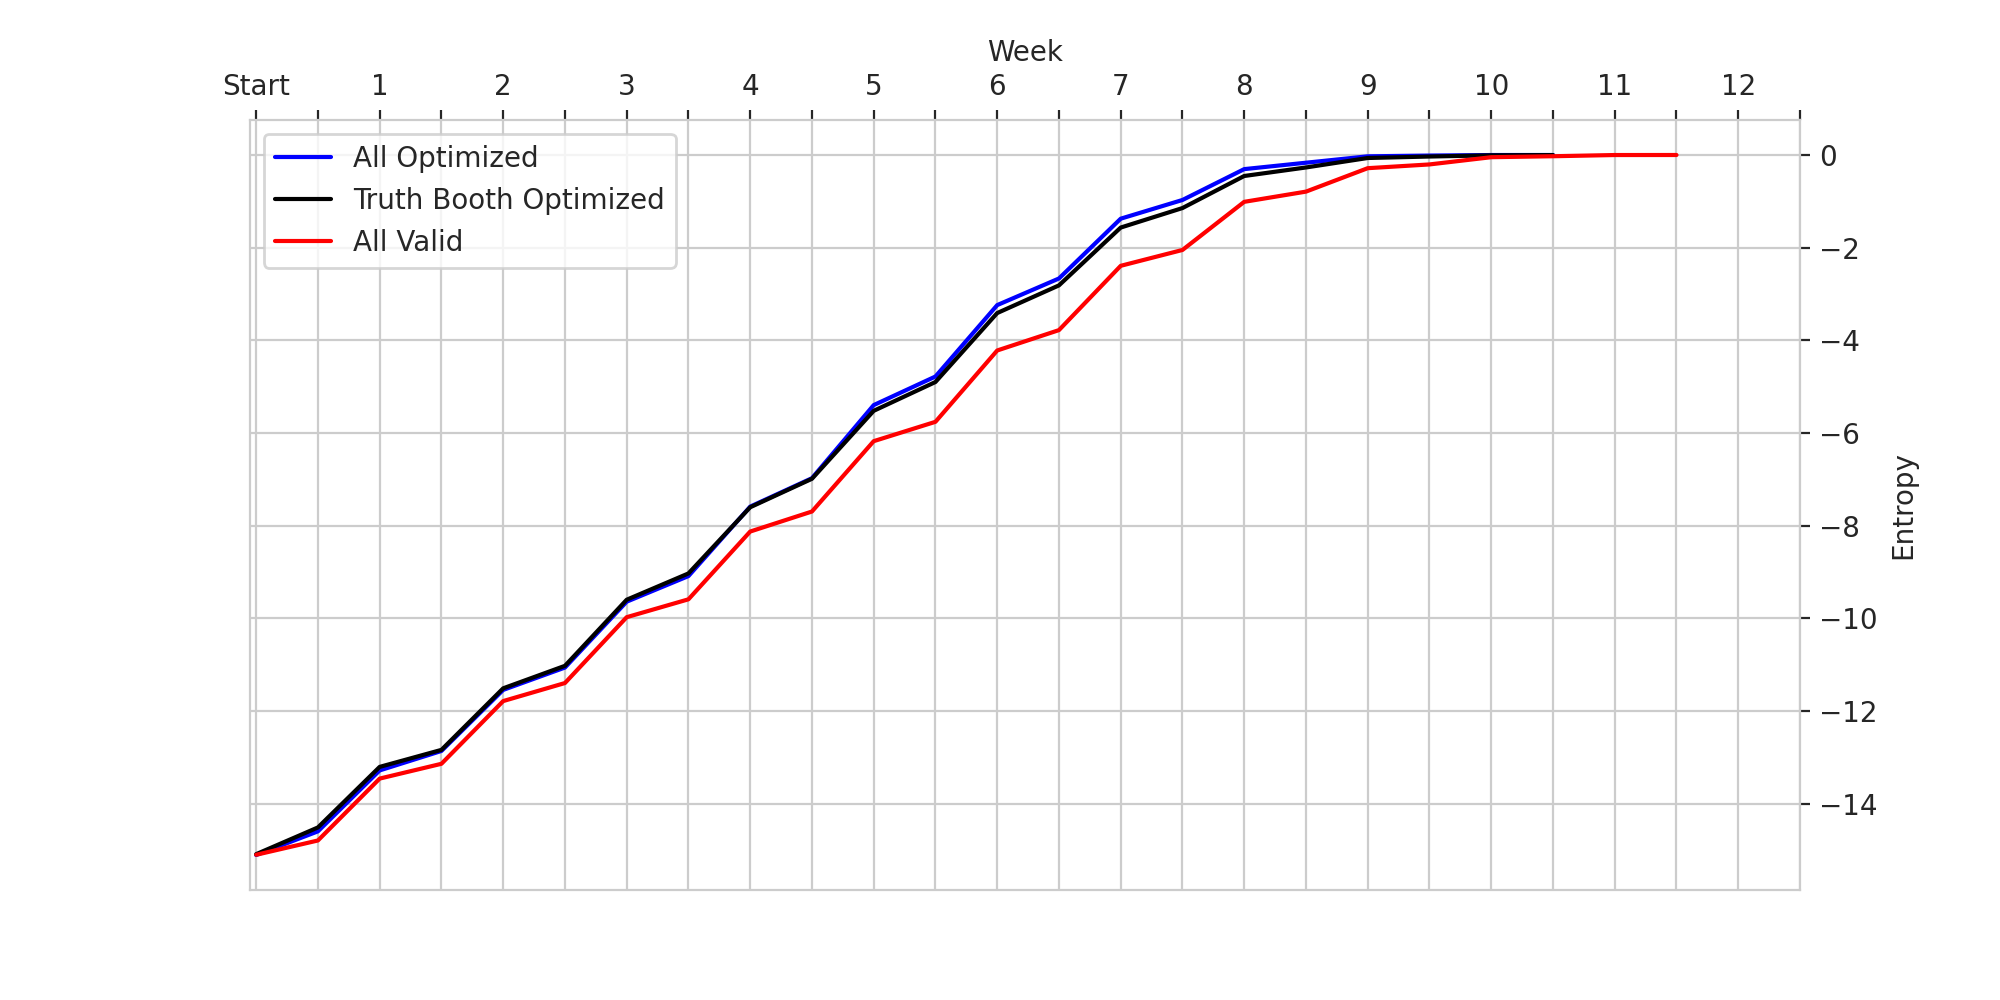
Optimizing the light ceremony gives very slight gains in performance. To see why this is, we can visualize the average information gain for each of these strategies at each timestep.
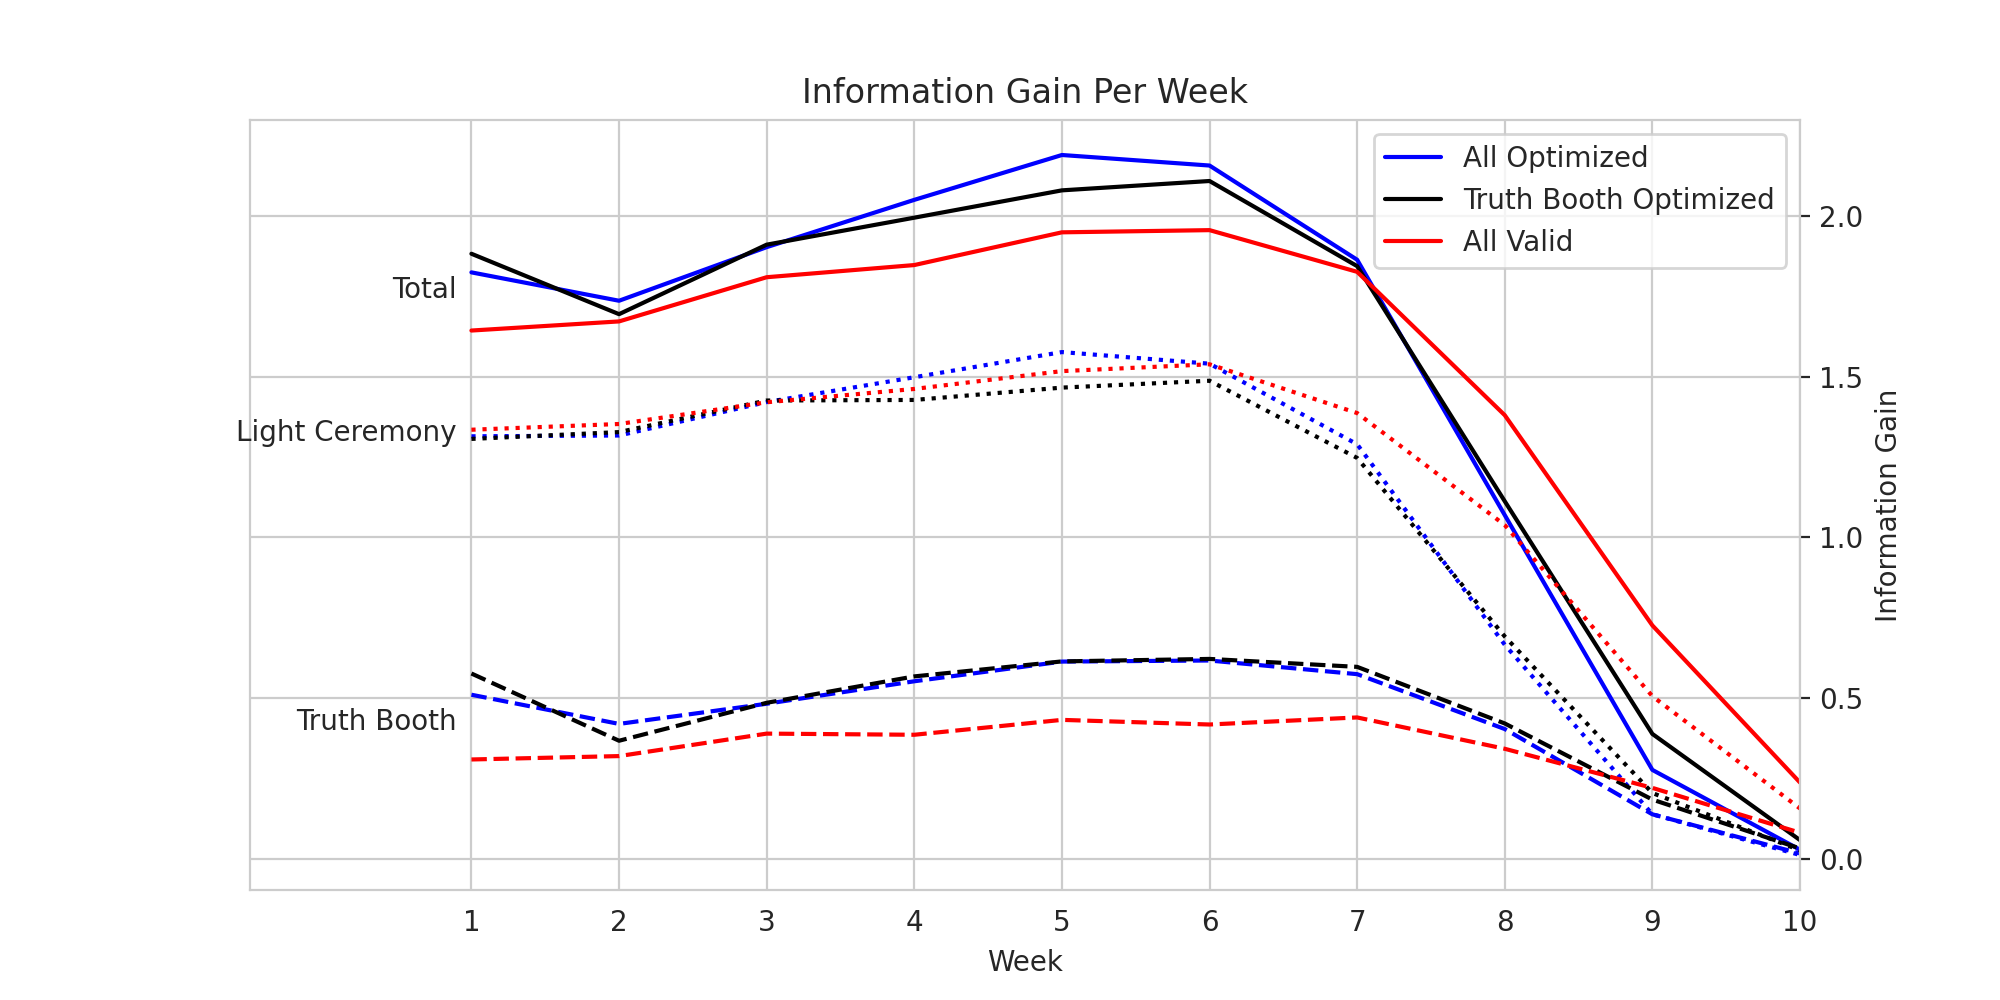
We can think of the “Valid Light Ceremony + Valid Truth Booth” case as a baseline. Optimizing the truth booth selection leads to a much higher increase in performance over the baseline than just optimizing the truth booth. It seems that although you gain more information from the light ceremony generally, the worst case is much closer to the best case than in the truth booth.
Could we have reached a 100% win rate if we just kept increasing the computational budget? Following the Knuth paper cited in the intro, we can find this out by rephrasing the question: assuming the contestants make optimal decisions, can they guarantee a victory in the worst case? We can simulate the worst base by treating the problem as a zero-sum two player game. The contestants are still trying to find the perfect match, but now the producers are actively trying to stop them.
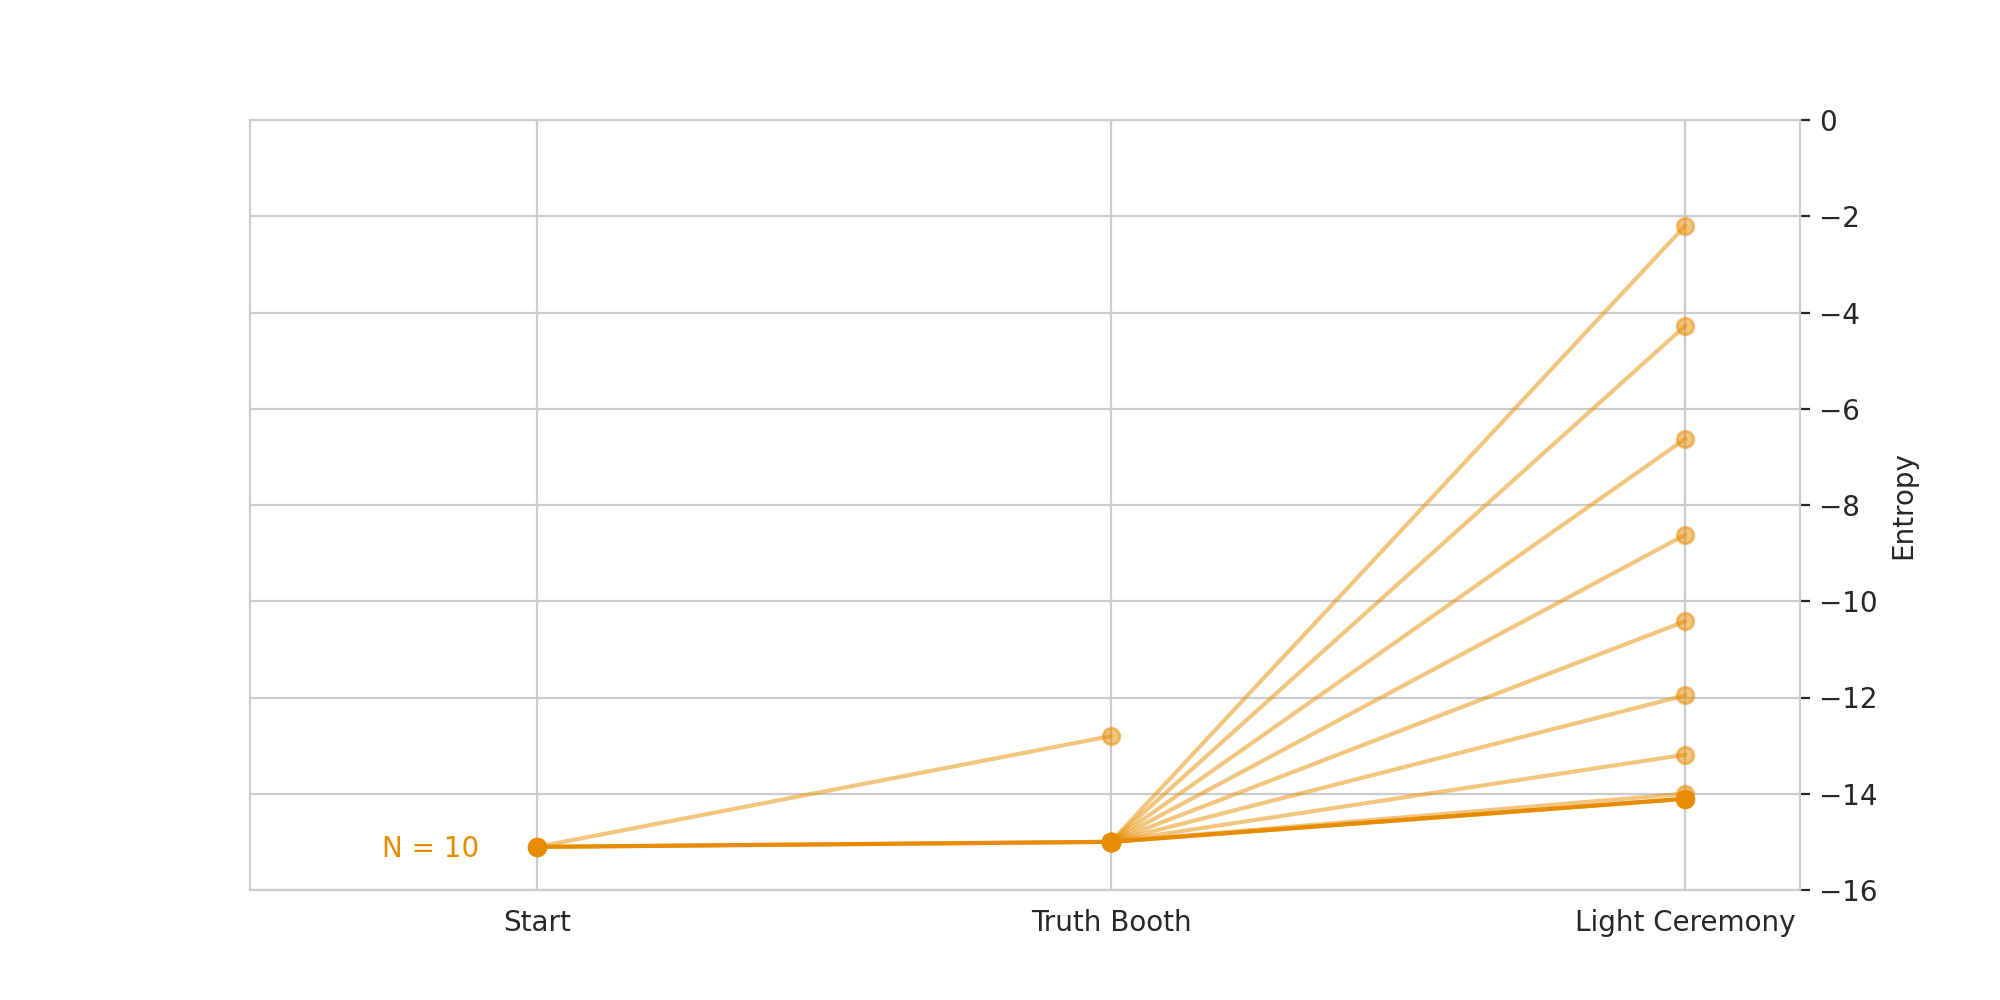
At every timestep, the contestants will either select a possible truth booth pairing or light ceremony matching. Each of these will have a discrete number of possible outcomes. The producers will be able to select any one of these outcomes, no matter how unlikely. For the producers, the optimal set of moves will now be the inverse of the target for the contestants: they want to minimize information gain at every timestep. For a given set of possible outcomes, this is easy to calculate. We can simulate the optimal producer behavior as simply iterating over all of the possible outcomes, calculating their information gain, and selecting the minimum.
To find the optimal strategy for the contestants, we can use a minimax approach: the contestants should select the truth booth pairing or light ceremony matching that has the best worst case performance. Knuth describes this as the selection that “minimizes the maximum number of possible outcomes,” but as we’ve shown this is identical to maximizing the worst case information gain.For the truth booth phase, this does not change our optimized selection algorithm at all. For the light ceremony phase, we have to change our target slightly, changing the value from the mean outcome to the minimum outcome.
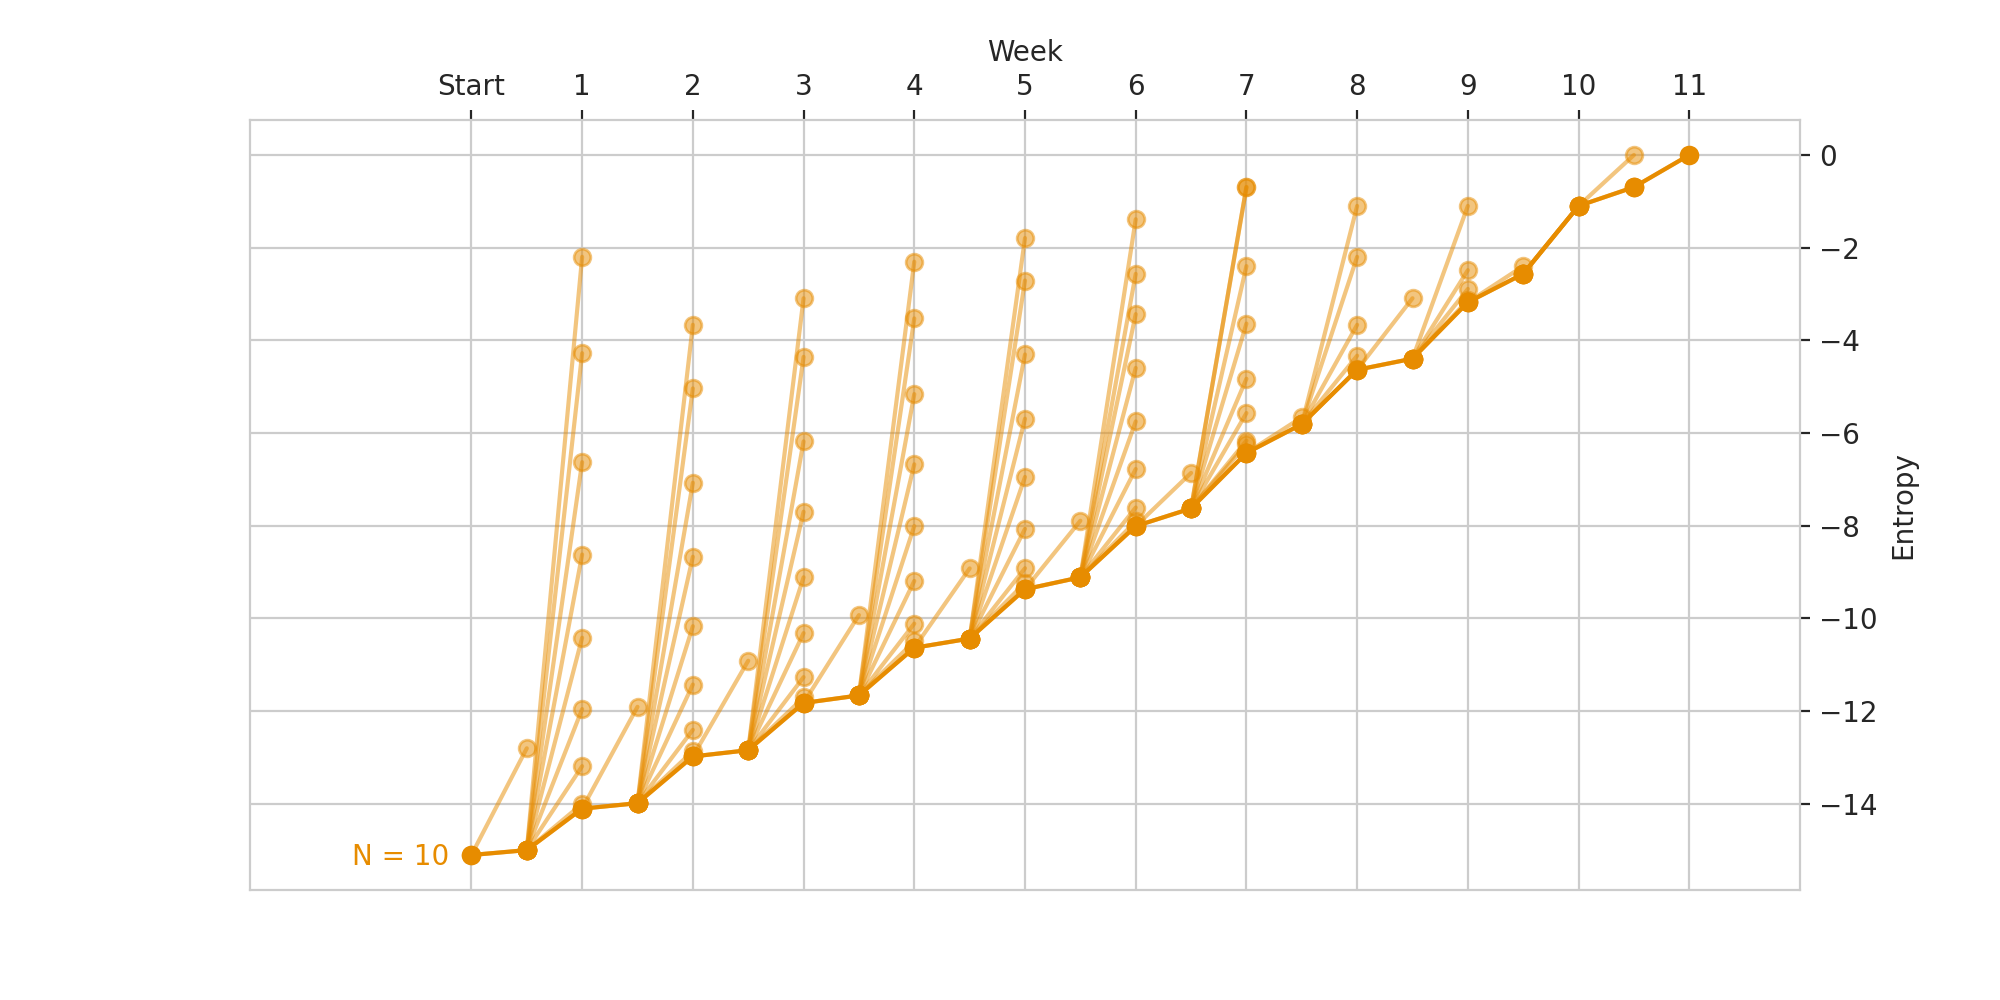
For \(N = 10\), it takes 11 weeks to win in this case. This then proves by contradiction that for arbitrary \(N\) men and women, you cannot guarantee the discovery of the perfect match in \(N\) weeks.
Out of curiosity, we can run this for other values of \(N\). 10 is the first \(N\) such that you cannot find the perfect match in at most \(N\) weeks.
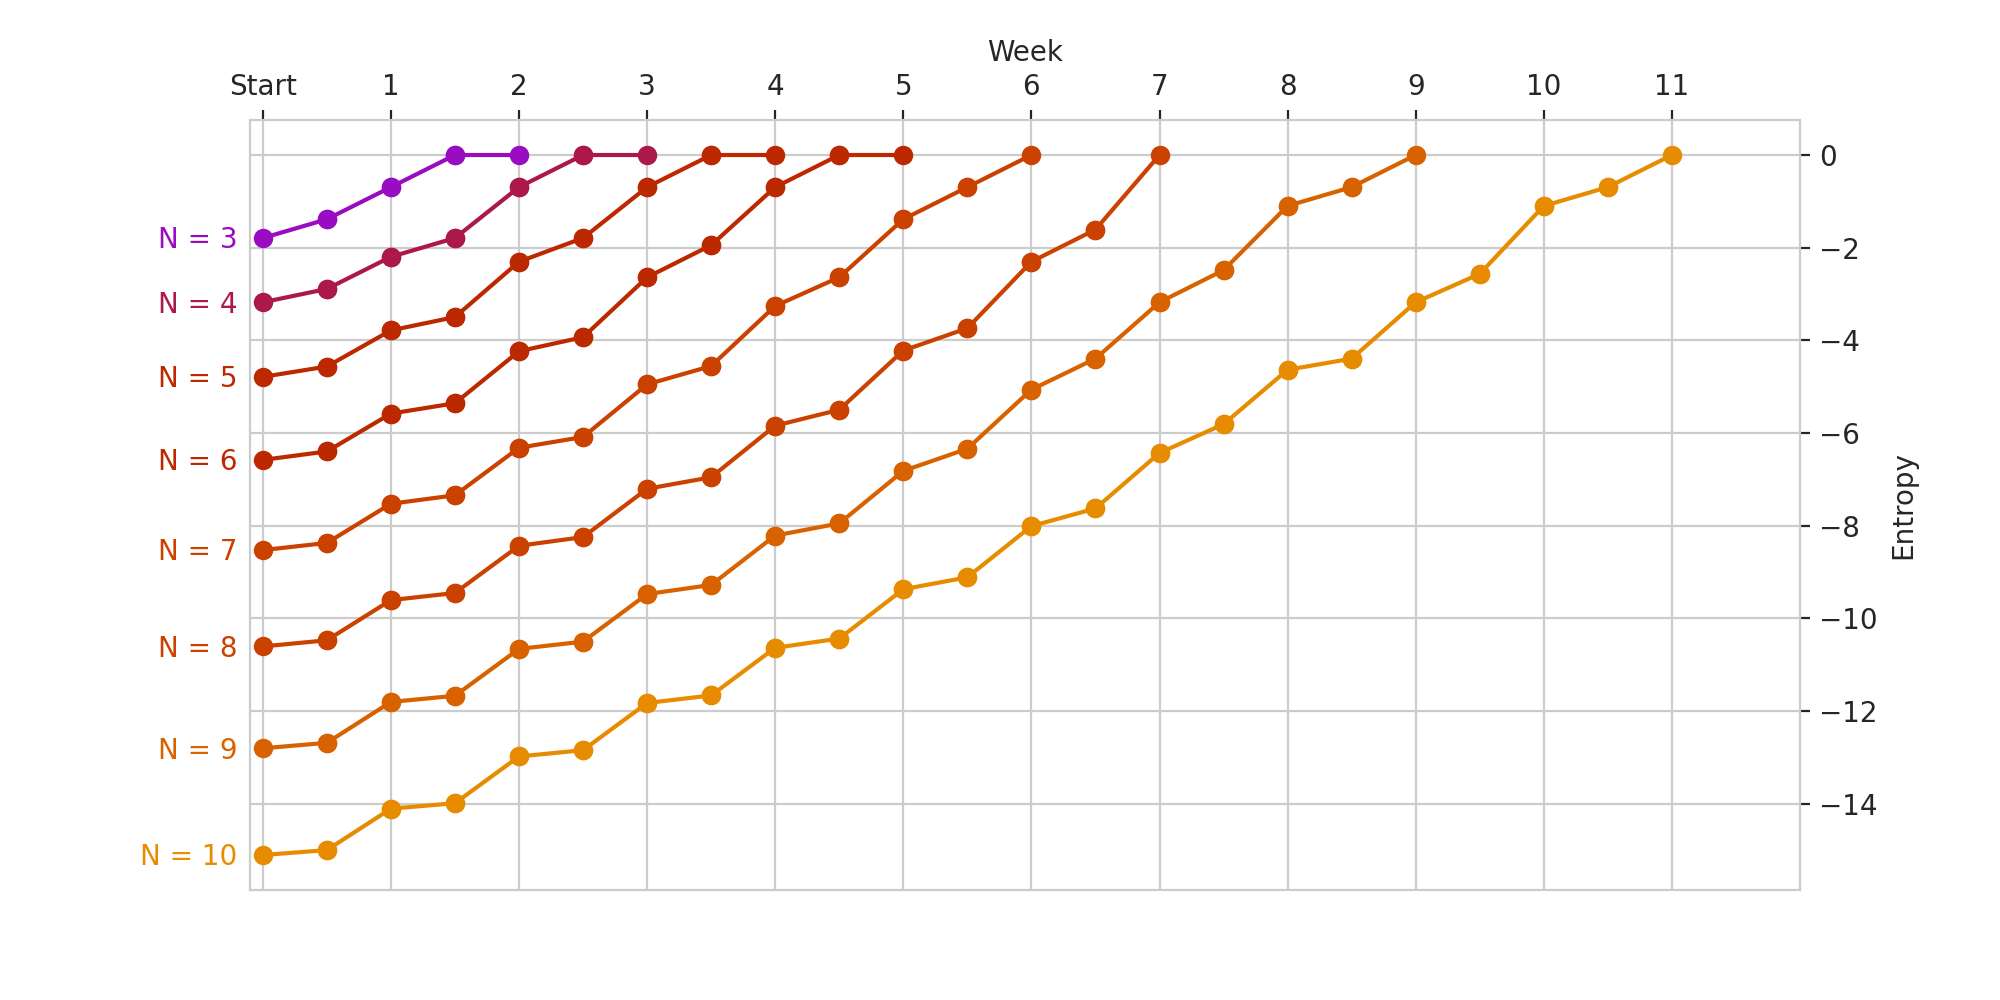
I wonder if that was on purpose?
Different bases for the log will lead to different units of entropy. Here we will be using \(\ln\), which means we will be measuring information in “nats”. One nat would be the equivalent of the information gain from an event with probability \[ \frac{1}{e} \approx 0.3679 \]. More info on the nat here↩