Trying to come up with a rigorous way to pick a march madness bracket is surprisingly difficult. For the large majority of games there is no question about who the favorite is. In fact, each bracket comes with a handy numbering system that tells you how good each team is compared to the other teams. For every single matchup, the high seed will most likely win almost without exception. 1 The difficulty then is not trying to figure out who is the better team, but when to deviate from the most likely choice. “Chalk” is a term used to describe when you never deviate and simply select the best team to win every time.
We can think of each individual bracket selection as it’s own little two player symmetric game. Imagine you are picking a single game against one other person. If you both pick the favorite, its immediately a tie. If a player deviates and selects the underdog, they strictly decrease their own expected value since by definition they are less likely to win. If you were to compute the nash equilibrium of this matrix or do any other kind of quantitative strategic analysis, the result would likely be that you should never deviate.
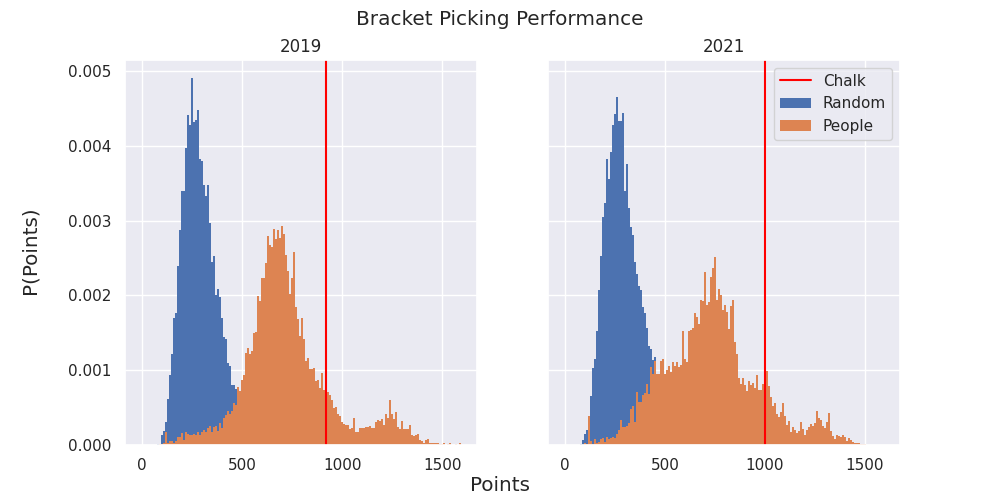
If you look at real world performance, we see something similar. I scraped 10,000 random brackets submitted from 2019 and 2021 and measured their performance compared to chalk. As expected, deviating from chalk strictly reduces the expected value of your bracket. You can imagine slightly expanding the previous game to be “always pick the favorite” versus “sometimes deviate.” The same argument would apply to always picking the favorite. On average, you are always better off. We are left with an interesting problem: there are no good upsets to pick but you cannot win unless you pick upsets.
However, the preceding analysis is misleading. If a bracket selection was a purely one-on-one endeavour, then chalk would be the rational choice. Instead, bracket performance is evaluated in a group. The metric that we care about is not raw expected points, but the probability of outscoring everyone else in that group. Intuitively, if our predictions are too similar to everyone else’s, our odds of winning decrease since our outcomes will be highly correlated. If our predictions are too far from everyone else’s, our odds of winning will decrease as well, since we will be forced to pick results that will likely be major upsets will not be well correlated with the actual results.
The conventional thinking then is that you should pick something that is close enough to chalk to be good, but not too close that it is not unique. The larger the group, the bigger the deviation needed from chalk in order to win. Then by strategically picking “undervalued” upsets, you can gain ground on the other brackets. Although this is theoretically sound, many people overrate the size of this effect in practice.
To investigate this, I simulated bracket groups of different sizes. For each size, I sampled N-1 non-chalk brackets and compared them to the chalk bracket. 2 I repeated this process many times, and then compared the probability of winning with chalk to the probability of winning otherwise (or, just 1/N).
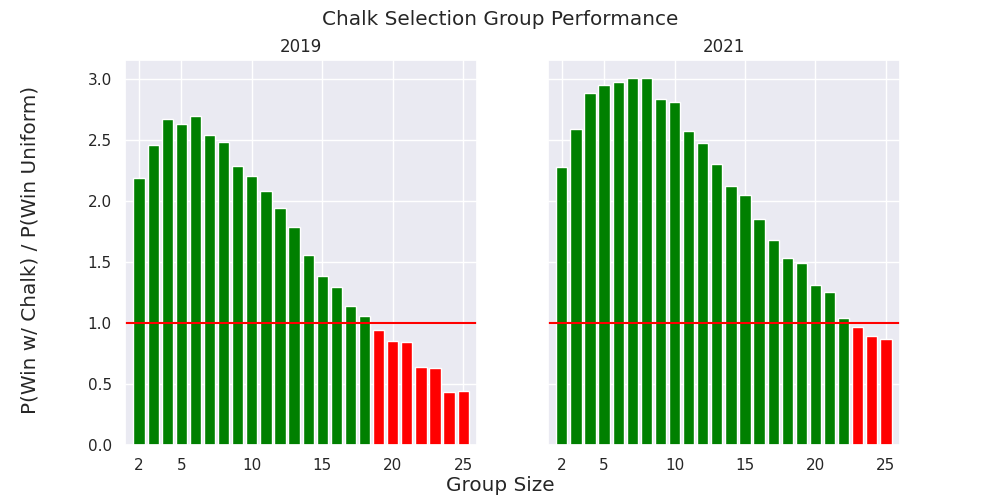
As you can see in the above plot, the probability of winning as chalk is still better than deviating for group sizes up to around 20. To dive a little deeper into what is going on, we can compute a “chalk-score” for a bracket by computing what score the bracket would get if there were no upsets. This gives us a rough idea of how many upsets that a bracket has, and how extreme those upsets were. All upsets would get a 0, no upsets would get a perfect score. We can look at this measure versus the actual performance.
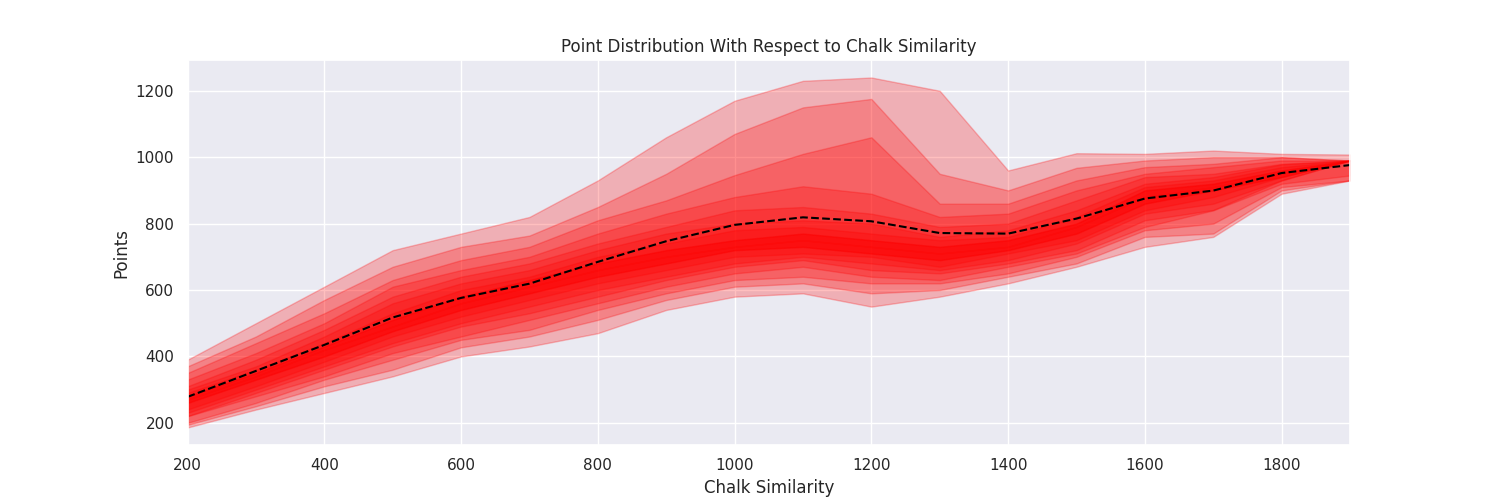
The mean mostly increases towards full chalk, but the variance is very non-uniform as we might expect. We see an interesting hump in the middle, which represents a potential sweet spot in terms of number of upsets. This can also just represent the people who got the champion correct, since the overall one seed didn’t win in either year. Here, the 95th percentile out performs everything else.
We can visualize these two distributions a little more. We can compare a chalk-score in the “high upside” region" to the variance in the “high mean” region.
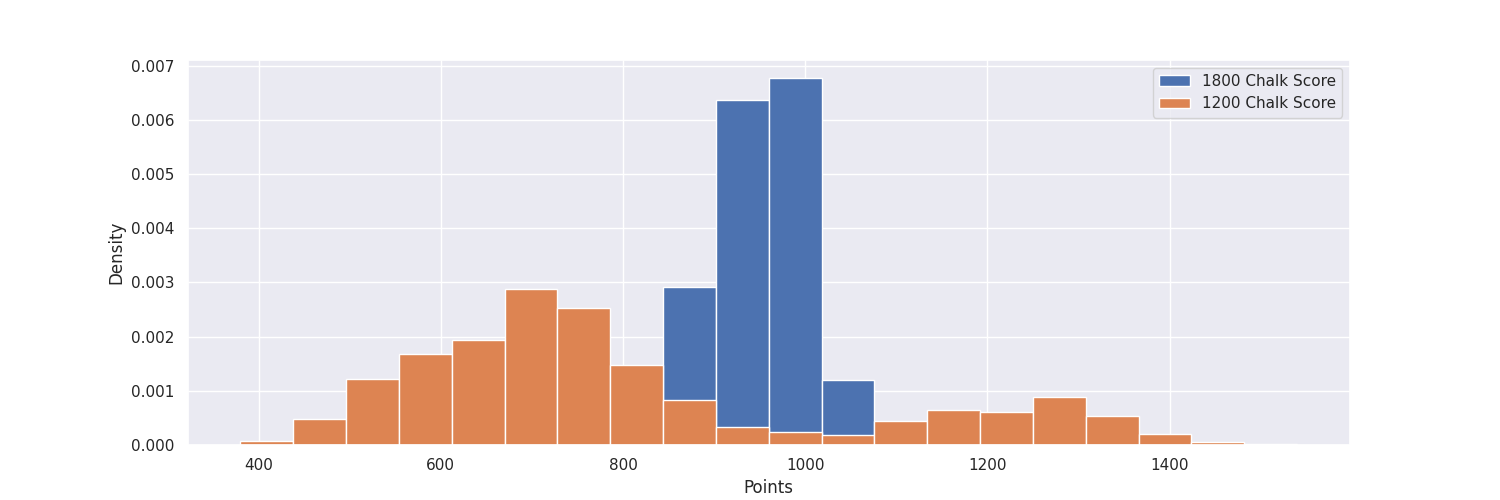
We can think of sampling from these like a slot machine. If you just wanted a high score, you should clearly pull the high-chalk lever every time. If you wanted to score more than a group of people, you would be more drawn to the high upside pick as the number of people you are trying to outscore increases. The problem is that more people are drawn to the high upside lever than they should be. Of course, this analysis is rather limited. Two years is a fairly small sample size 3, but the general takeaway holds: chalk is a underutilized strategy.
The problem is, of course, that if more people realize this, then more people are going to end up selecting chalk. If just one other person in your group selects chalk, your probability of outright winning goes to 0 and the probability of a tie goes way up. Currently, only a small portion of brackets end up being chalk. Less than 5% of the brackets I collected were chalk.
When chalk is in play, each bracket selection becomes an exercise in chicken. The goal is to make the other guy swerve and pick upsets. If you both swerve, you’re both playing the same slot machine; you can have the same expected payout in theory. If no one swerves, its a tie and everyone effectively loses. They only way to improve your odds of winning consistently is to get the other player to pick upsets while you pick all the favorites.
Although chalk as a strategy is much maligned, there is a compelling statistical argument for it. In reality it is also a gamble, but a slightly different one. You are betting on everyone else not doing the obvious. So next time you see only one person with a final four of all one seeds in your bracket group, don’t think “how lame!” Instead, consider that you may have just flinched.
When these types of “mis-seedings” exist, or when a team is an underdog based on seed but the common opinion is that they will win, it usually commonly known and reflected in the betting odds for that matchup. These are not discovered by any one individual through independent research, no matter how many times you google “potential upsets march madness.”↩
Some years are definitely better than others, but neither 2019 or 2021 were particularly favorite friendly. The overall didn’t win in either, and only a single one seed made it to the final four both years.↩
Some years are definitely better than others, but neither 2019 or 2021 were particularly favorite friendly. The overall didn’t win in either, and only a single one seed made it to the final four both years.↩