
Fantasy Football is a fun game to play with your friends.
Every player has a team of NFL players that receive points based on how they play each week. These teams are decided by a draft at the beginning of the year. This draft is largely considered the main determination of success. Although managing a fantasy football team can be fun, the true fun comes in beating your friends so this draft is very important. This post covers how I was able to build a drafting algorithm with deep reinforcement learning
Fantasy football leagues have many different drafting formats, but ours is a snake draft. We draft 16 players total to fill the 11 roster spots plus an additional 5 “bench” players. These players are held in reserve in case one of your starters becomes injured or has a bye week.
The players that fill the roster spots are called “starters.” Players can only score points when they are starters. There are two main kinds of spots: position spots and flex spots. A position spot would be QB (quarter back) or RB (running back). These can be filled by players of only that position. Flex spots can be filled by players of multiple positions. For example, there is a “Super Flex” spot that can be filled with players of any position and a WR/TE spot that can only be filled by wide receivers or tight ends. The table below contains all of the roster spots for our league.
| Position | Spots |
|---|---|
| Quater Back (QB) | 1 |
| Running Back (RB) | 2 |
| Wide Reciever (WR) | 2 |
| Tight End (TE) | 1 |
| Kicker (K) | 1 |
| Defense (DEF) | 1 |
| WR/RB/TE | 1 |
| WR/TE | 1 |
| QB/WR/RB/TE | 1 |
| Bench | 5 |
There are two main components to building a drafting algorithm. The first is estimating how many points each player is likely to score. Obviously, you want to draft the players that are going to score the most points. Much like I laid out in In Defense of Chalk, trying to beat the open source projections is a fools errand. If you could do so consistently, you should stop playing fantasy football and make your fortunes sports betting. Thankfully, there exist a number of websites to have player point projections that have been created by experts. To estimate the projected points for out players we can just take the average of a few available sources to reduce the noise a bit and leave it at that.
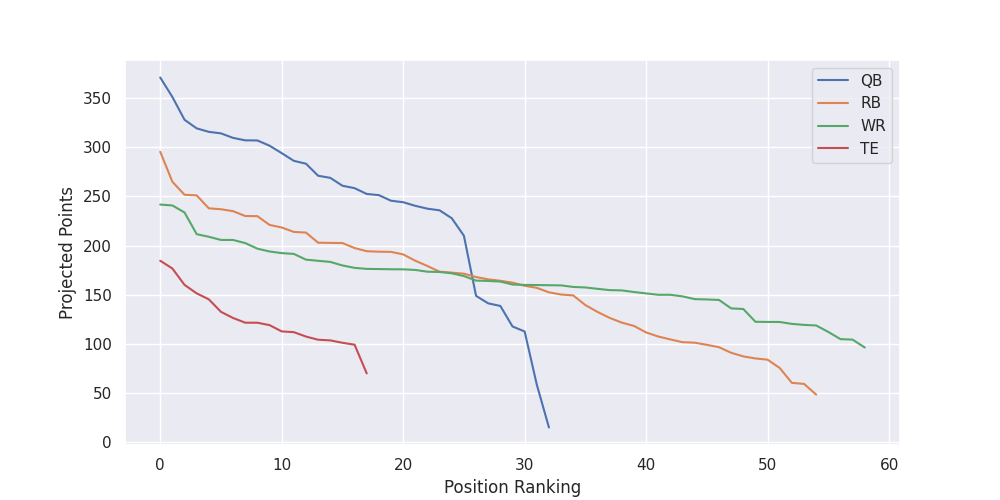
The second is your player selection algorithm that decides which player to pick when. What makes this an interesting problem is that you need to draft to a fill a roster, not just pick the highest projected players. The above plot shows the point projections for each position. Although they tend to score the most points, filling your team entirely with quarter backs will do you no good. You need to fill every spot on your team as best you can.
This means you need to be cognizant not only of the players points compared to other players at the position, but also to the players already on your roster. Not only that, but you need to have an understanding of what the other players drafting will do. It does not make sense to draft a player if you are confident they will still be available the following round. The value of a player is the value they contribute to their roster spot over their replacement if you do not draft them. But figuring out exactly who their replacement would be is non-trivial.
If we wanted to get the perfect solution this problem, we would have to think in terms of game theory. However, this problem has many factors that make it difficult to analyze. First, it is difficult to phrase as a zero sum game. Each player is trying to maximize their own points, but not necessarily minimize the points of everyone else. Second, it’s a multi-agent problem. Our league has 10 players in it. It is possible to frame the problem as one player versus a hive mind representing the other nine players, but that would make the game non-symmetric. Third, the game has a very large action space. Enumerating the possibilities are out of the question. Let’s say there are 200 players that might get drafted. Each of the 10 players needs to draft 17 players to fill their team. Then there are
\[ \frac{200!}{(200 - 170)!} \approx 3 * 10^{342} \]
unique drafts that could occur. Lets say we just wanted to find the optimal first and second round for the player with the first pick. They have 200 options they can make for the first pick. Then, there are
\[ \frac{199!}{(199 - 19)!} \approx 2 * 10^{43} \]
possible picks that could then happen between the two picks and then 181 options to consider after. That gives you about \(10^{50}\) scenarios to enumerate. Still far too many.
We need to simplify this down to something manageable in order to make some progress. The first key decision we can make is abstracting the player selection. In the above calculations, we assumed that every player is effectively equally likely to be picked. We already know the projected points for each of these players. Assuming these are accurate, why would you ever select a QB that has a lower projected points when a player with a higher projections is available? If we take the projected points at face value, the crux of the problem is not what player to pick but what roster spot to fill. Do you take RB’s early and then WR’s? Or do you reach for the one TE that will out score the others?
We can instead give each player the option to simply select a position and receive the player with the highest project points at that position. This is certainly a lossy abstraction and it neglects to take into account many different issues, such a players disagreeing on projections, personal preferences, and most importantly the distribution behind the projection. We are summarizing these projections with only a mean, but variance is also very important. Rookies for example tend to have a low projections, but have the potential for a high upside. Some positions, for example WR, tend to have a much higher variance. However, we should still roughly expect that within each position group players are roughly going to come off in the order of their projections.
This means that instead of thinking about deciding between all players available at a time, we only need to consider the position groups. We can simplify this even further in two ways. Of the 17 players drafted, the first nine are significantly more important than the players drafted to fill out the bench. We can just focus on drafting players to fill out the nine roster spots we have available. Since kickers and defenses are normally drafted in the last few rounds, we can ignore these positions groups all together. This means that instead of thinking about 200 different players that we can draft, we now only have to focus on four positions groups: QB, WR, TE, and RB.
We can also drastically simplify our considerations for what the other players are going to do. Instead of trying to think of each player as their own unique entity, we can lump them together as a group and try to simulate their behavior.
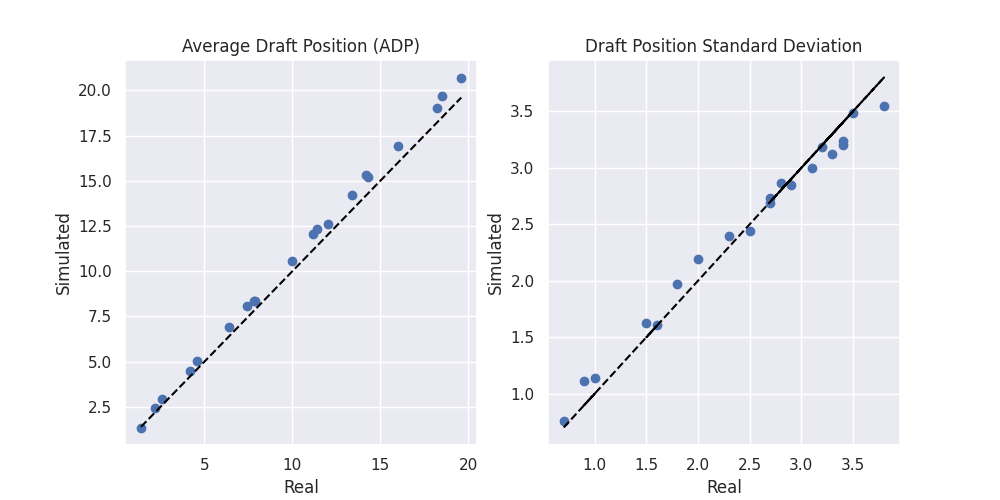
There are multiple websites that post statistics about mock drafts. This one here posts the minimum, maximum, mean and standard deviation of each player in the mock drafts. This is enough information to roughly approximate a distribution for each player. The beta distribution can give us a distribution between 0 and 1 with a specified mean and variance. We can scale the range by the maximum and minimum value and then fit the beta distribution to the statistics. This will give us a distribution that matches the given statistics.
We can then convert this distribution over picks per player into a distribution over players by pick by creating a grid of probabilities and re-marginalizing along the pick axis. This will then allow us to sample which player will be drafted at which pick given the current list of players available. This is not perfect, but it gives us something that is close enough to be useful.
Lets say we have pick number 7. We can simulate a draft by stepping through the picks one by one. First we simulate the first pick and remove the player from the draft. Then the second, and so on. Once we reach our agent we let it make its pick however it wants, and then again remove that player and continue.
This, importantly, also gives us a method in which we can define the replacement value of a player. We can now define it in expectation to our draft distribution. Meaning, we can simulate the outcome for any pick by sampling the remaining picks via this distribution. The “value” of any pick is in terms of the total value of the roster after drafting against this simulation.
Finally, we now want to develop our player selection algorithm. To do so we will be using a simple form of deep reinforcement learning called REINFORCE. The reinforcement learning algorithm that you select here really does not matter, and REINFORCE was selected for simplicity of implementation.
At a very high level, reinforcement learning is all about learning a policy. This policy is a function that maps a current representation of the environment, or state, into a probability distribution over all of the valid actions. The goal of reinforcement learning is to learn a policy that maximizes the expected value of a reward function. This reward function is some measure of performance. For example, a reward function for chess could be a 1 for winning and a -1 for losing. Learning a policy that maximizes the expected value of this reward function would result in learning a policy that maximizes the odds of winning. Deep reinforcement learning is just reinforcement learning when your policy is represented by a deep neural network.
To represent the “state” for this problem, we included two main types of information. First, the projected points of the best available player at each position. This gives the player an idea of the comparative value of the current available players. Second, the state of its current roster. To include this information, we take the current players on the agents team and assign them roster positions. Then, we compute the total remaining players for each roster spot. This tells the player what remaining spots are still available to be filled.
To represent our policy, we used a simple feedforward neural network with exactly nothing notable about it. This network takes as input the state vector described above and outputs a probability distribution over the four position groups.
The algorithm works as follows. For a given pick number, simulate until its time for out player to draft. Sample the position group to draft via the player’s policy and select the best available player at that position. Add this player to the agents team and simulate until the next pick. Once the player has reached nine players, estimate the value of the roster, treat this as the reward, and then use this to update our policy. If the agent drafts a player that cannot fit in the lineup (i.e. a third QB), they contribute zero points. The goal of our reinforcement learning algorithm will be to learn a policy that maximizes the final point total of our roster.
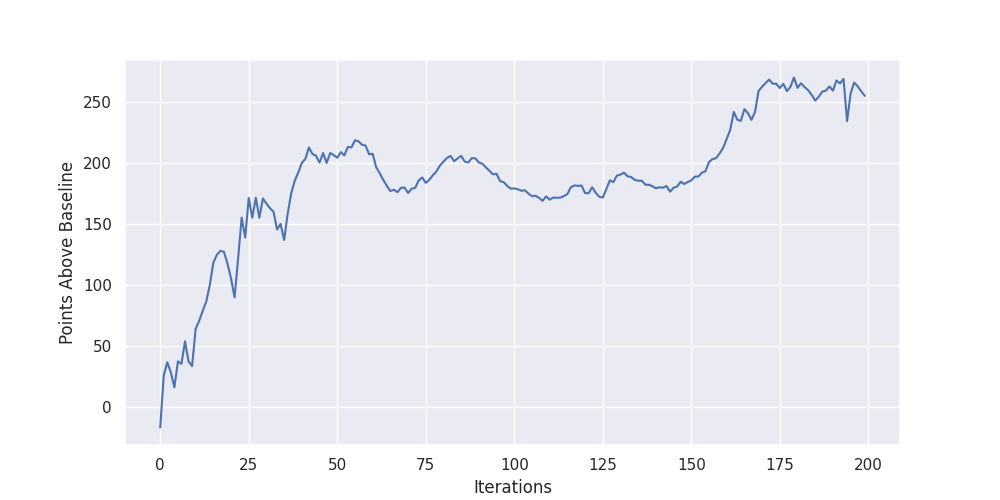
To help improve the learning signal, we baseline our estimated performance by semi-random behavior. We computed the average estimated team projection if you just filled open roster spots randomly, and subtracted this from the projected points achieved by our player. The result of this optimization process can be seen above. Our policy was able to learn a drafting strategy that contributed 250 points over our baseline.
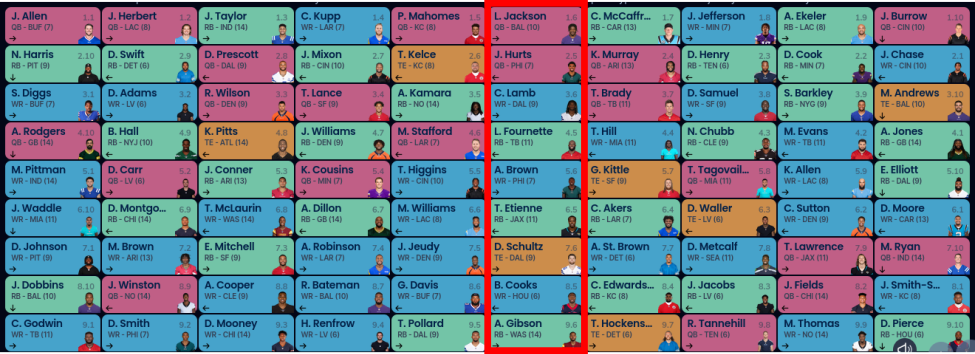
I then used this algorithm to make my first nine draft picks during the draft. Although I had one of the worst draft picks (picks towards the beginning or end are preferred), I ended up having the second highest projected points going into week one. Since that was exactly I was optimizing for, I would call that a success.
So far, my team has scored the second most points with a 5-3 record. Is this the result of my drafting algorithm? Hard to say. At the very least, we can say it wasn’t catastrophic. And that is good enough for me compared to past years.
Is this the best way to draft? Probably not. It would have likely been more time-efficient to just make a draft board from scratch and read up on the top players. But as I said, the goal of fantasy football is to have fun beating your friends and beating them with DRL is one of the most fun ways I can think of.